
How to Read a MAP Student Progress Report
A MAP Student Progress Report contains many numbers.
Below is NWEA's Student Progress Report Quick Reference. It uses a numbered sample report to explain what each item means.
We'll use this image to walk through the key items that help you understand the report. The numbers in the headings match those in the image.
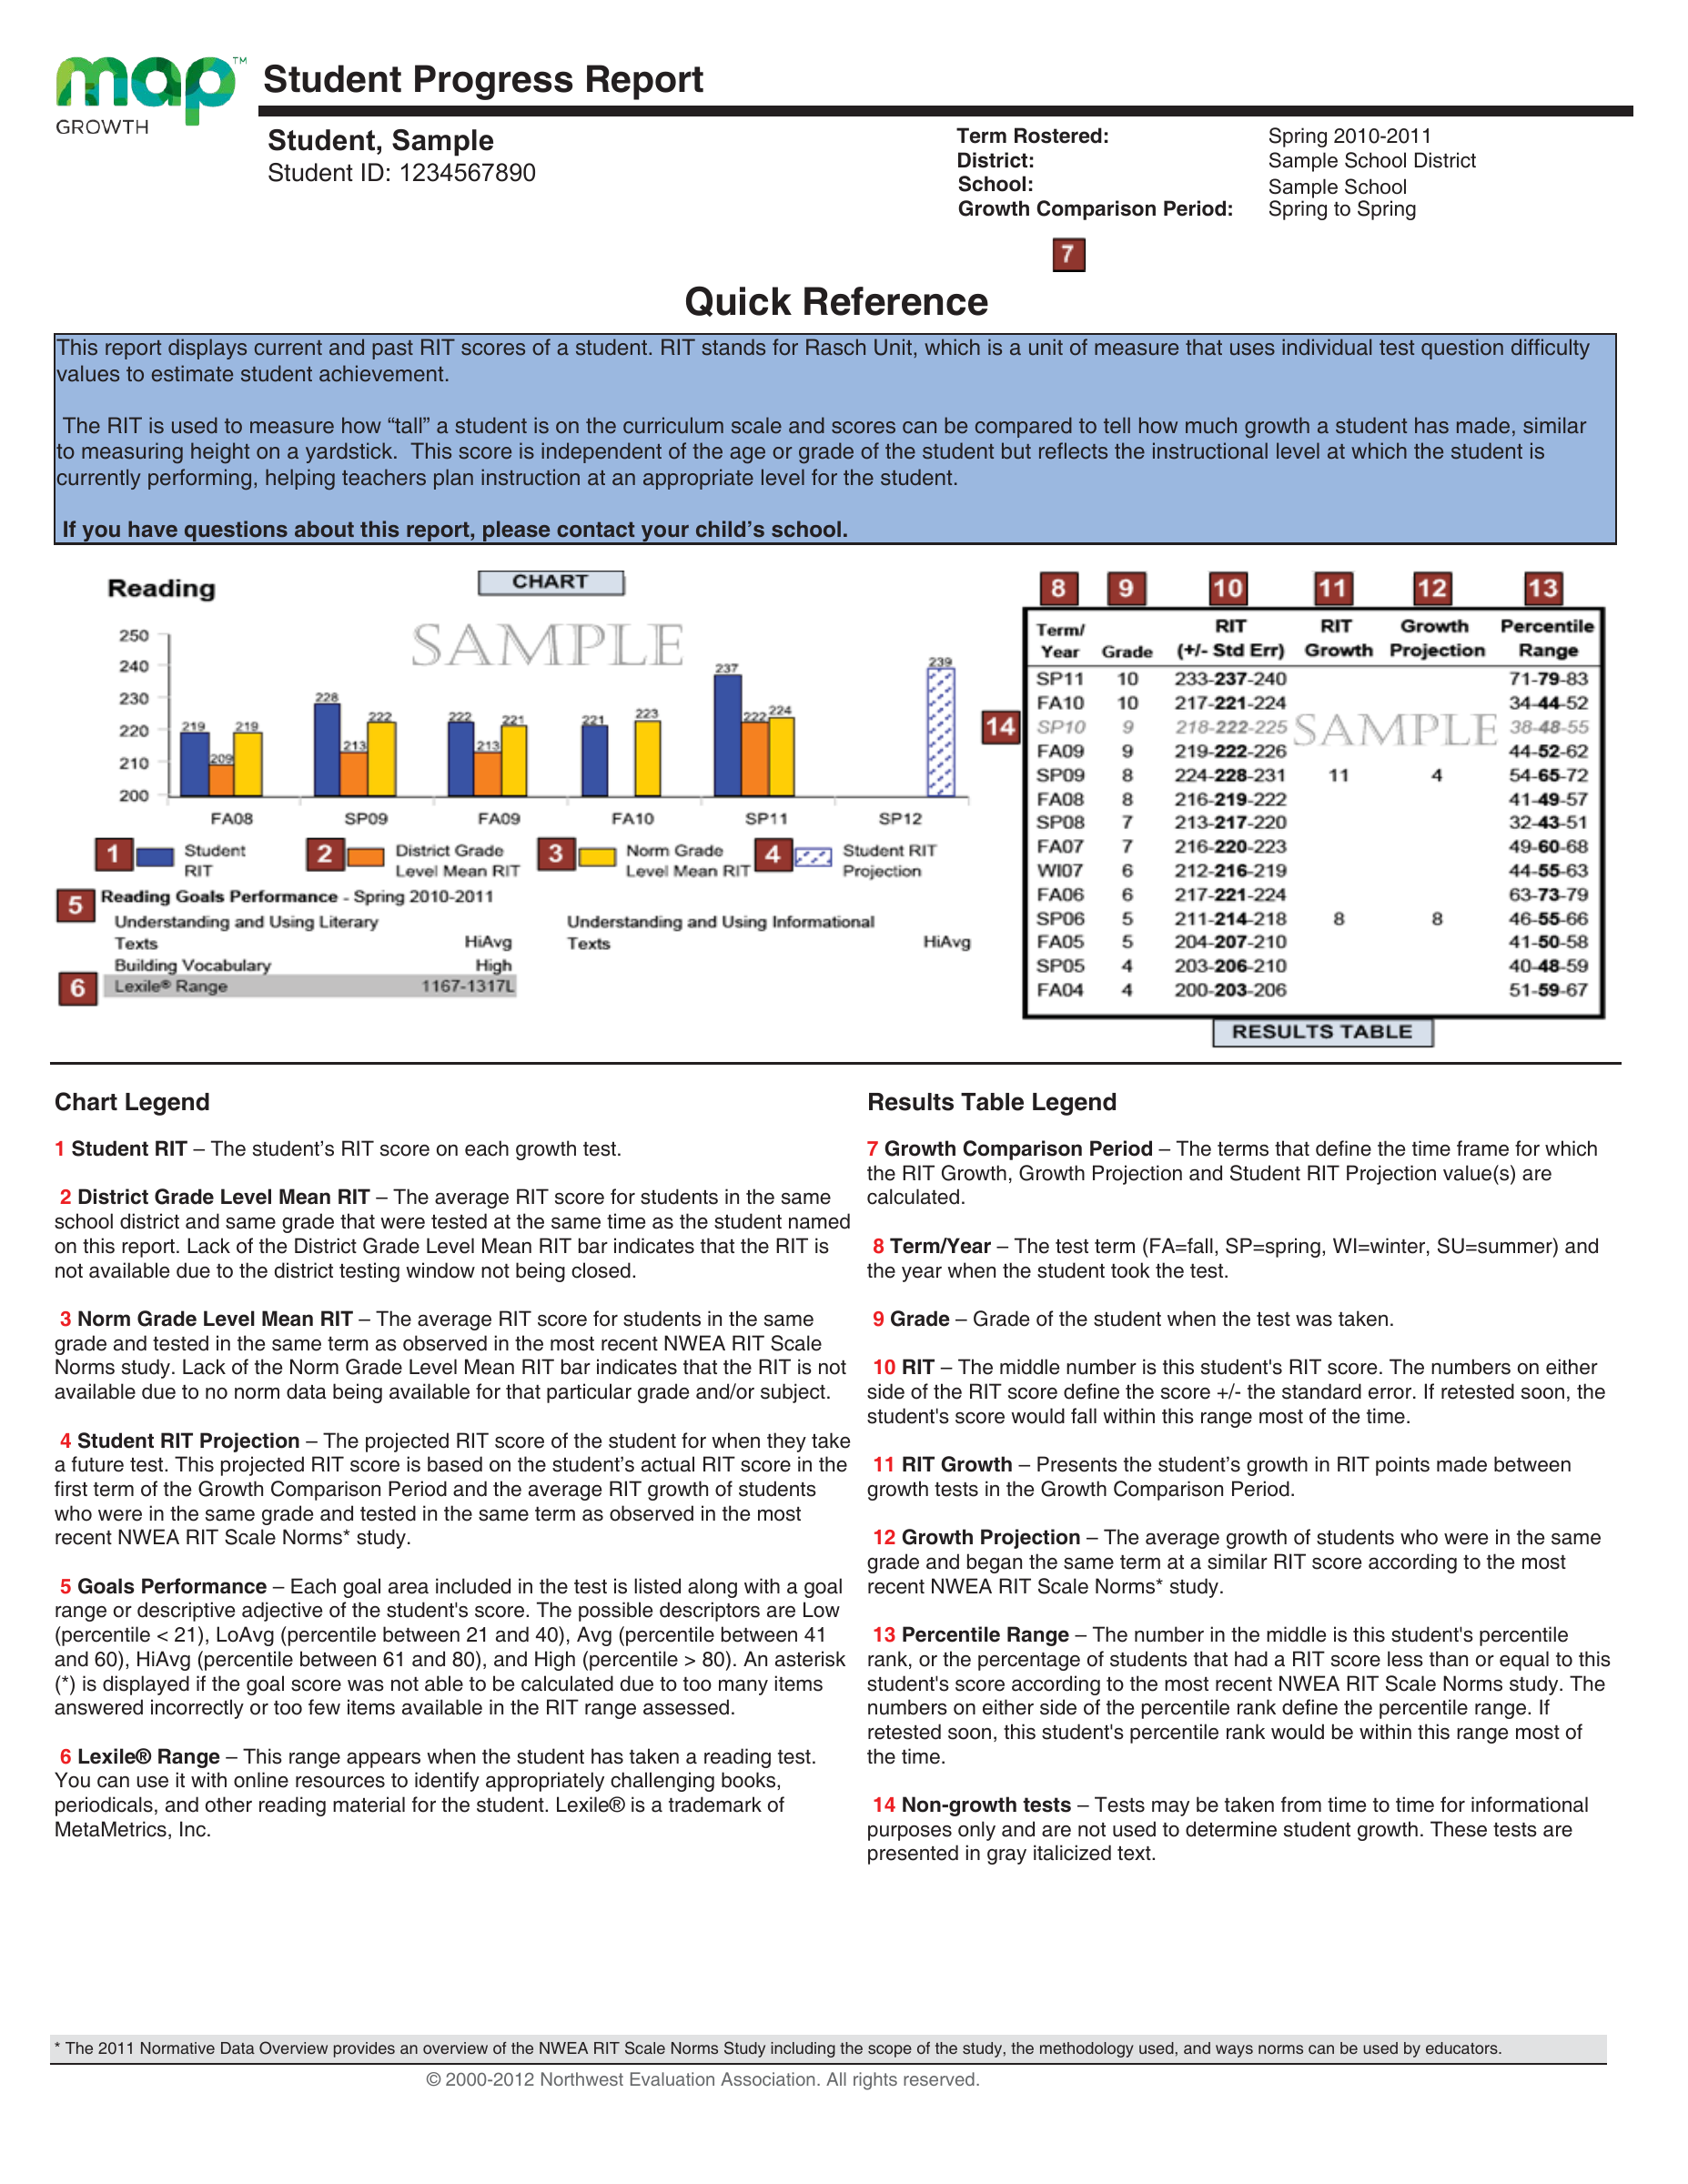
Source: NWEA, Student Progress Report Quick Reference [1]. © 2000–2012 Northwest Evaluation Association. This sample uses the 2011 norms. The explanations below were also checked against NWEA's current official guidance [2].
Norms — Reference Data from Past Test Results
Norms are reference data that NWEA develops by analyzing previously collected student test results. The data are designed to represent U.S. students and are organized by grade, subject, and testing season to help interpret scores and growth.
The years in 2020 Norms and 2025 Norms identify the version of the reference data. For example, the 2025 Norms use test results collected from fall 2022 through spring 2024. Your child's score is interpreted using the reference for the same subject, grade, and testing season in the norms version being applied. A fourth-grade fall Reading result, for instance, uses that version's fourth-grade fall Reading reference. [3]
Norms help answer the question: "How much do students in this grade, starting at a similar score, typically grow over the same period?"
The report parents receive includes measures such as Percentile and Growth Projection calculated from these data. Mean scores and mean growth by grade, subject, and season are listed on pages 1–2 of NWEA's 2025 Norms Quick Reference PDF [3].
MapMastery interprets changes in your child's score alongside their grade, starting score, and the time between tests. The same increase can mean different things depending on the circumstances in which it occurred.
Measurement Error — Why RIT and Percentile Each Show Three Numbers
A test estimates a child's learning level from the questions they answer and their responses. Any score from a single test has some uncertainty. The Standard Error of Measurement, or SEM, indicates the size of that uncertainty. Put simply, it tells us how precisely the score was measured. A smaller SEM means a more precise measurement. [4]
To show this uncertainty, ⑩ RIT and ⑬ Percentile in the image each display three numbers.
- RIT: The middle number is the measured score. The numbers on either side are that score minus and plus the SEM.
- Percentile: The middle number is the percentile. The numbers on either side are the percentiles corresponding to the lower and upper ends of the RIT range.
This means that measurement uncertainty in the RIT score is also reflected in the percentile range. When a score or percentile changes slightly, looking at the range can help you interpret that change more carefully. [2]
①·⑩ RIT Score — Current Learning Level, Measured Independently of Grade
A RIT Score is an objective measurement calculated from question difficulty and your child's responses. NWEA explains that it indicates the level of content a child can currently understand and work with, regardless of age or grade. [1]
In the same subject, the same RIT Score represents a learning level on the same scale, even for children in different grades. This allows you to follow changes across scores as your child moves from one grade to the next. [5]
We can then ask a more specific question: "What concepts might my child understand at this score level?" MapMastery explains the learning concepts associated with the score range and reads them alongside results in individual areas and past records. This connects a numerical learning level with what it may mean for a child's understanding of specific concepts.
④·⑫ Student RIT Projection · Growth Projection — Projected Score and Projected Growth
④ Student RIT Projection is the RIT score your child is projected to receive in a future testing term. For a Fall to Spring projection, for example, the projected spring score is calculated by adding the norms-based projected growth from fall to spring to your child's fall RIT Score. In the image, it appears as a diagonally striped bar. The term below the bar tells you which testing term the projection is for.
⑫ Growth Projection is the number of points your child is projected to gain. For Fall to Spring, it is based on the average growth through spring in the norms for students in the same grade who had a similar RIT Score in the fall. Read this alongside ⑪ RIT Growth, your child's actual change in score from fall to spring. [2]
For Fall to Spring, Student RIT Projection is the score projected for spring, while Growth Projection is the number of points the score is projected to rise from fall to spring.
MapMastery reads actual and projected growth alongside your child's past records.
⑤ Goal Performance — Results Within a Subject
Goal Performance breaks down a subject into learning areas. Each area is shown as a RIT score range or as Low, LoAvg, Avg, HiAvg, or High. These five categories indicate where the area's score falls within the norms reference group. [2]
Children with similar overall RIT Scores can have different results across learning areas. Goal Performance helps identify areas of relatively stronger achievement and areas that deserve a closer look within that subject. MapMastery connects each area's name with the concepts it covers. This helps parents understand the strengths and areas needing support within an overall score in terms of specific learning content.
⑥ Lexile Range — Choosing the Difficulty of Reading Materials
Lexile Range is a range provided from the Reading test results. NWEA recommends using it to find books and other reading materials at an appropriate difficulty level for your child. [2]
Comparing a book's Lexile measure with this range can help you gauge its difficulty. Within that range, choose topics your child finds interesting and pay attention to how much they understand as they read.
⑦·⑪ Growth Comparison Period · RIT Growth — The Period and the Actual Change
RIT Growth is the change in score over the period shown in ⑦ Growth Comparison Period. For Spring to Spring in the image above, it is the spring score for that year minus the previous year's spring score. For Fall to Spring, it is the spring score minus the fall score. [2]
One RIT Growth value captures the change between two tests. Looking across several testing periods helps you see whether scores rose steadily, stayed at a similar level for a while, or moved up and down.
MapMastery reads this pattern of change. We explain both how much has changed and how that change connects with earlier results. When records are limited, we explain what changes can be observed and the limits of what can be interpreted.
⑧ Term — Why Schools Test in Fall, Winter, and Spring
FA stands for Fall, WI for Winter, and SP for Spring. According to NWEA, most schools administer MAP Growth at these three points: the beginning, middle, and end of the school year. Some schools test twice a year.
Testing at different points helps schools understand a child's current learning level, track changes over time, and use the results to inform teaching. Fall results show the starting point for the new school year. Winter results show changes along the way, and spring results help show growth as the school year comes to a close. [6]
⑬ Percentile Range — Relative Position Within the Norms
Percentile is calculated by placing your child's RIT Score within the norms for the same subject, grade, and testing season. A percentile of 70, for example, means the score is equal to or higher than the scores of approximately 70% of students in the norms reference group. A higher number indicates relatively higher academic achievement within the reference for that grade and testing season. [5]
The reference is a score distribution NWEA developed from past test data. The same RIT Score can have a different percentile depending on the grade or the fall, winter, or spring reference used. The norms version being applied also matters when interpreting the result. [7]
RIT Score shows your child's learning level. Percentile shows that score's relative position within a defined reference. Reading both helps distinguish changes in learning level from changes in relative position.
MapMastery first looks at how your child's RIT Score has changed, then considers Percentile and results in individual areas to identify what deserves a closer look.
Reading the Items Together Reveals the Pattern of Growth
RIT Score shows the current learning level, while RIT Growth shows change over a particular period. Norms-based Percentile and Growth Projection provide context for understanding that score and growth. Goal Performance adds detail about individual areas within a subject, and Lexile Range helps with choosing reading materials.
The same score can reflect different paths and different results across learning areas. Looking at the current score alongside past records and learning content helps us think more specifically about the support a child may need.
MapMastery reads current and past results together and explains your child's pattern of growth in language parents can understand.
Sources
- [1] NWEA, [Student Progress Report Quick Reference (PDF)](https://teach.mapnwea.org/contents/guides/SPR_Quick_Reference.pdf)
- [2] NWEA, [Student Progress Report](https://teach.mapnwea.org/impl/maphelp/Content/Data/SampleReports/StudentProgressReport.htm)
- [3] NWEA, [MAP Growth 2025 Norms Quick Reference (PDF)](https://www.nwea.org/resource-center/fact-sheet/87992/MAP-Growth-2025-norms-quick-reference_NWEA_onesheet.pdf)
- [4] NWEA, [Making sense of standard error of measurement](https://www.nwea.org/blog/2025/making-sense-of-standard-error-of-measurement/)
- [5] NWEA, [What does RIT stand for in MAP testing?](https://www.nwea.org/blog/2026/what-does-rit-stand-for-in-map-testing/)
- [6] NWEA, [Common questions families](https://www.nwea.org/the-map-suite/common-questions-families/)
- [7] NWEA, [MAP Growth Norms](https://www.nwea.org/map-growth-norms/)
MapMastery's analysis is not an official result of any assessment organization and is provided for educational purposes.
Comments
Please log in to leave a comment.
Be the first to leave a comment.